November 2022
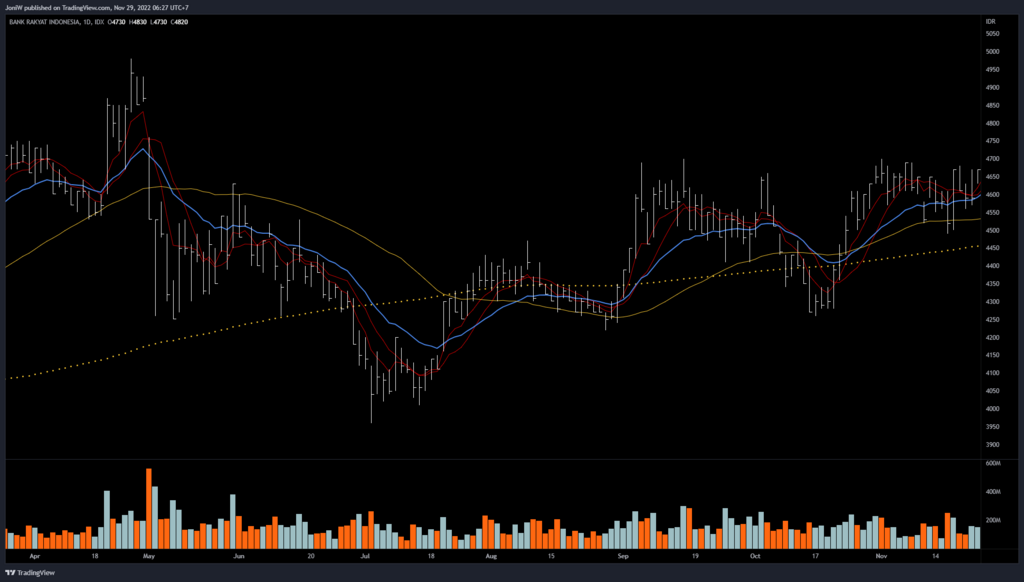
I believe I missed BBRI.⌗
I think it didn’t show up in my scanner due to 20% cut-off from the 52-week-low.
Do I need to change it?
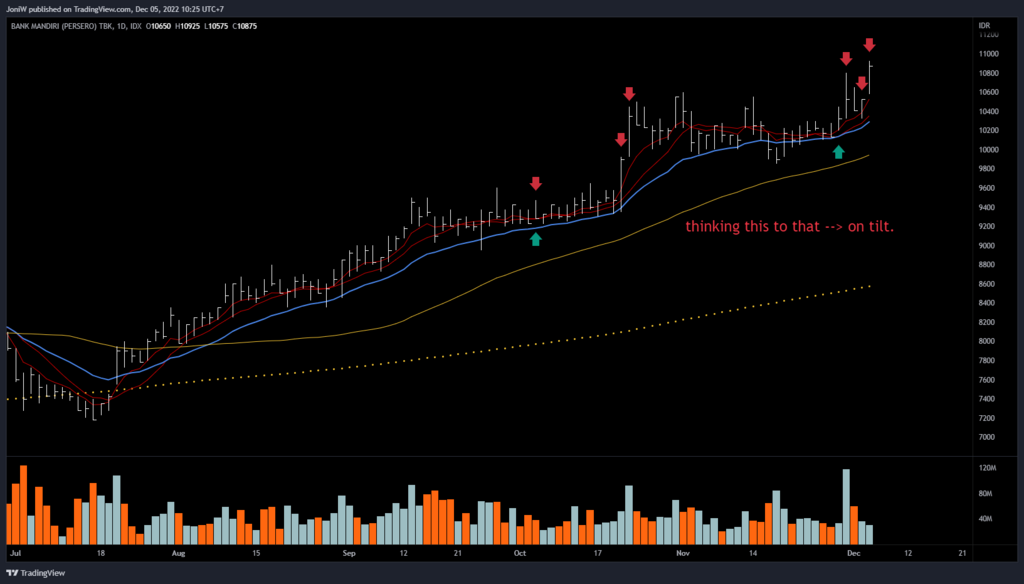
ANSWER: NO. Trade BMRI correctly. Size correctly. Brush up emotion correctly. No hubris. No A then B correlation.
FUCK. THE HOMEWORK THAT I MISSED!!!!!!!⌗
I was arguing with the setups.
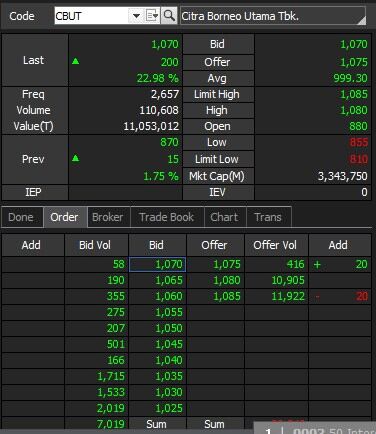
And.. My size was only 200.⌗
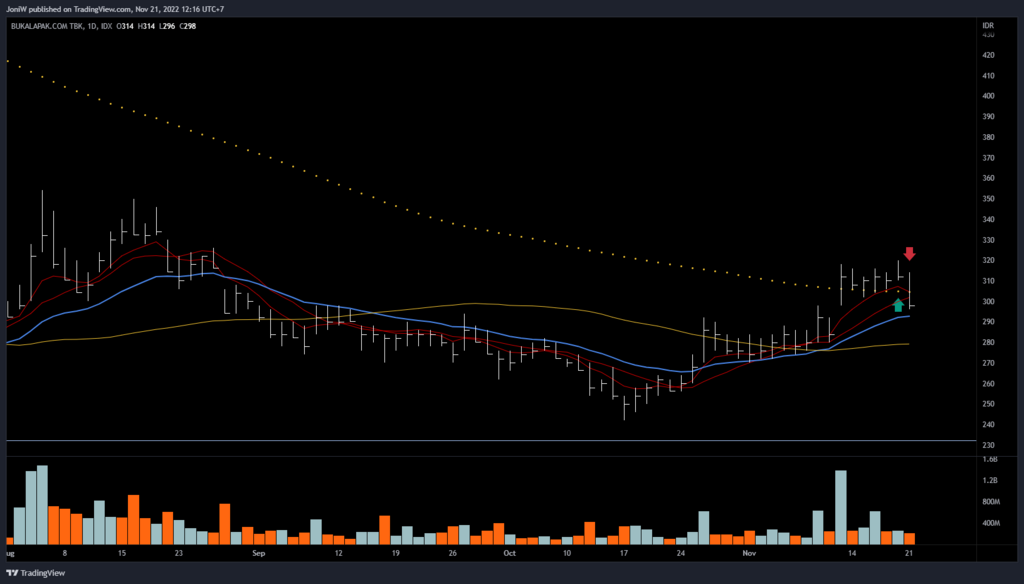
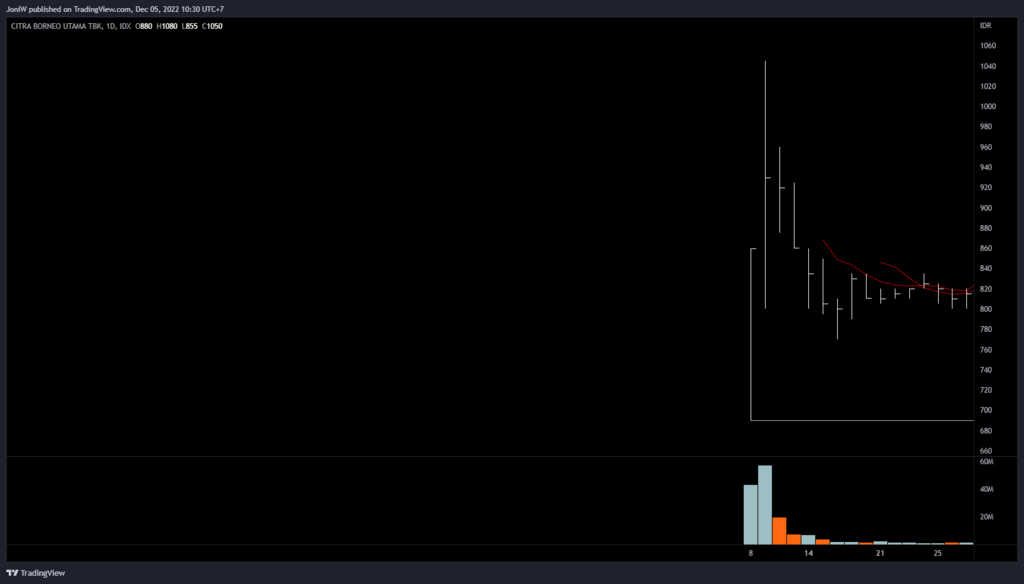
At the moment before crossing the line of least resistant, the supply-demand look thin.
Anyway, I can reduce the size.
gw ga tau mau taruh dimana ini. Dari Gemy.
Jadinya titip taruh di post ini deh.
On http://Coursera.org, some ML courses by Andrew Ng are great, including Machine learning specialization and Deep learning specialization. Thanks.
Data science is a general science, not specifically for stock trading. Even after you have completed studing, you are not guaranteed to succeed in finding a good model. It’s not easy, needs lots of experiments.1/3
Now turn to your question:
-
You must first have some ideas/guesses about trading.
-
You figure out a target outcome,like 5% in 1 week etc. You guess some indicators/features may have effects on it.
-
Then you want to infer the relationship between the features and the outcome. This is where data science can play a role.
Data science only helps in step 3.
These are some of the features which I used, fyi:
- (rolling return, rolling average volume, rolling high, rolling low ) over windows (120, 30,10,5,1) days.
- industry identity
- cap size
- some other self-defined features
I remember you asked this question before. It seems you still get puzzled. Indeed I don’t have/use that ratio. I do have measures to control risk, but it’s a different structure which I can’t easily explain in common terminology.
Mostly day trading, a few 2-3 days.
Urutannya:⌗
- AI
- ML
- NN
- DL
ML jadi DL jika neuron diatas 3 layer.
udah, cmn gt aja.
Dari video matlab ini, untuk DL butuh data lebih banyak dan GPU power lebih tinggi.⌗
Liat di detik terakhir ada comparison table.